Amidst the ongoing energy crisis and subsequent commodity price inflation, the year 2022 proved to be fairly favourable for the renewables sector. A recent report, titled “Renewable Power Generation Costs in 2022”, by the International Renewable Energy Agency (IRENA) highlights the global trends in cost competitiveness observed across various renewable energy technologies since 2010. This article presents the key findings of the report.
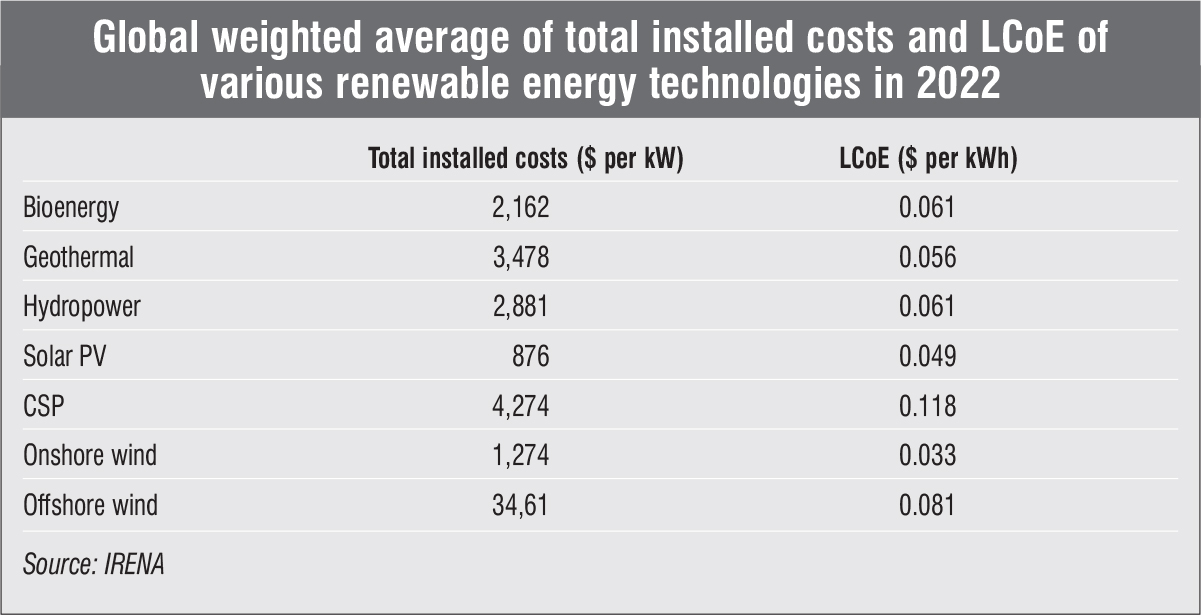
According to the report, the global weighted average cost of power generation has significantly declined across solar PV, concentrated solar power (CSP), onshore wind, geothermal and bioenergy technologies. For instance, in 2010, the global weighted average levellised cost of energy (LCoE ) of onshore wind was 95 per cent higher than the lowest fossil fuel-fired cost in 2022. Similarly, the global weighted average LCoE of new onshore wind projects was 52 per cent lower than that of the cheapest fossil fuel-fired solutions. Solar PV, which was 710 per cent more expensive than the cheapest fossil fuel-fired solution in 2010, costs 29 per cent less than the cheapest fossil fuel-fired solution in 2022.
Despite supply chain interruptions and price inflation, the 2021-22 period witnessed one of the largest improvements in the competitiveness of renewable power in the past two decades despite an increase in material and labour costs, underscoring the economic benefits and energy security provided by renewables in the face of market volatility. The year 2022 also saw record capacity additions of solar PV, while onshore wind and offshore wind capacity additions declined marginally compared to the 2020 and 2021 levels.
 In 2022, 295 GW of renewable capacity was added globally, marking a 12 per cent increase from the 264 GW added in 2021. Of the recent augmentation, solar PV contributed 191 GW, representing a 36 per cent increase over the 141 GW added in 2021. Onshore wind capacity additions continued to decline for the second consecutive year, with 65.7 GW of installations in 2022, a 10 per cent drop from 2021. Offshore additions in 2022 stood at 8.9 GW, which is 55 per cent lower than the 19.9 GW added in 2021. This slowdown can be largely attributed to China, which witnessed a record installation of 17.4 GW in 2021 but saw a decline to approximately 4.1 GW in 2022.
Asia has been leading solar PV installations since 2013, with the total addition reaching 112 GW in 2022 (compared to 75 GW in 2021). Major capacity increases occurred in China (86 GW) and India (13.5 GW). Japan also added 4.6 GW, marginally surpassing its 2021 additions. Markets outside Asia also continued to gain scale, with the US adding 17.6 GW of solar capacity in 2022, followed by Brazil (9.9 GW), the Netherlands (7.7 GW) and Germany (7.2 GW).
Solar PV
After a continuous decline in the past decade, solar PV module prices increased by 4-7 per cent in 2021 due to supply chain disruptions and the rising prices of polysilicon in China from $12 per kg to $33 per kg. As a result, mainstream modules, which accounted for over 50 per cent of the market share, continued to experience a price hike of about 6 per cent, reaching $0.34 per watt in 2022.
Despite the rising prices of PV modules and commodities at the end of 2021 and into 2022, the global weighted average LCoE of newly commissioned projects experienced a 3 per cent year-on-year decrease to $0.049 per kWh due to a reduction in total installed costs. While declining module prices have primarily contributed to total installed cost reductions in the past, recent trends indicate the growing relevance of balance of system (BoS) costs in solar PV plants. The contribution of BoS costs to the total reduction in installed costs increased from 3 per cent during 2010-16 to 24 per cent during 2016-22. India continued to rank the lowest in terms of total cost of installed solar PV in 2022 at $640 per kW, while Japan had the highest total installed costs at $1,905 per kW.
Onshore wind
Wind power projects are increasingly achieving LCoEs of less than $0.040 per kWh and, in some cases, as low as $0.024 per kWh. In 2022, the global weighted average LCoE from onshore wind fell by 5 per cent, from $0.035 per kWh to $0.033 per kWh. The primary reason for the falling onshore wind LCoEs is the reduction in operations and maintenance (O&M) costs, as turbine price reductions contribute less in absolute terms to cost reductions given their current low levels. O&M costs, comprising fixed and variable components, typically constitute 10-30 per cent of the LCoE for the majority of projects. In contrast, turbine costs, which account for 64-84 per cent of the total cost of a wind power plant, increased in several markets across the world, except for China, where the average wind turbine price fell to approximately $10 per kW due to continued pressure on manufacturers from developers.
Offshore wind
The offshore wind segment has witnessed significant developments in the past decade, encompassing larger turbines, longer blades and higher hub heights. Access to better wind resources, improvements in fixed-bottom foundations and the relocation of wind farms further from the shore have led to significant improvements in capacity factors.
So far, Europe and China have been the primary drivers of deployments in the sector. With declining costs due to technology improvements and industry maturity, momentum on the policy side has also been positive. European countries such as Belgium, Denmark, Germany and the Netherlands have announced a target of reaching a combined total of 150 GW of offshore wind capacity by 2050. Offshore wind currently accounts for about 7 per cent of the total installed wind power capacity globally.
In 2022, the electricity cost of new offshore wind projects increased by 2 per cent year on year, rising from $0.079 per kWh to $0.081 per kWh. The distance from shore for offshore wind projects is currently in the range of 25-35 km, with an average water depth of 30 metres and an average wind farm size of around 450 MW.
Concentrated solar power
Compared to other renewable energy technologies, global capacity additions for concentrated solar power (CSP) have remained low, with only 1.5 GW being added in the past five years. The global cumulative CSP capacity currently stands at around 6.5 GW. During the past decade, the total cost of installed capacity for CSP has decreased by 50 per cent, even with the increase in the size of thermal energy storage systems. The cost reductions can largely be attributed to the decreasing cost of solar/heliostat fields and low-cost thermal energy storage systems.
Hydropower
The global weighted average LCoE for hydropower reached its highest recorded value in 2022. Continuing its increasing trend, the LCoE rose from $0.043 per kWh in 2018 to $0.061 per kWh in 2022. This increase can be attributed to rising installed costs, especially in Asia due to the increasing number of projects facing challenging site conditions and recent supply chain inflation. This is despite the fact that the majority of new capacity additions occurred in China, which added 13 GW and generally has lower-than-average installed costs. However, 2022 witnessed several large projects, notably in Canada and Lao People’s Democratic Republic, with significant cost overruns. It is interesting to note that the capacity factors of hydropower technology have fluctuated around the 45 per cent level in the past few years, while its LCoE has continued to increase during the same period.
Bioenergy
Bioenergy for electricity generation offers a range of options, spanning various feedstocks and technologies. In 2022, the global weighted average LCoE of biomass-fired electricity generation for commissioned projects stood at $0.061 per kWh. This marked a decrease from $0.071 per kWh in 2021, with rates ranging from a low of $0.060 per kWh in India and $0.062 per kWh in China to highs of $0.092 per kWh in Europe and $0.101 per kWh in North America.
The most competitive projects utilise agricultural or forestry residues already available at industrial processing sites, where marginal feedstock costs are minimal or even zero. Bioenergy-based combined heat and power systems can significantly reduce the LCoE for electricity to as low as $0.03 per kWh in cases where on-site industrial process steam or heat loads are required, depending on the alternative costs for heat or steam available. The typical share of feedstock cost in the total LCoE ranges from 20 per cent to 50 per cent.
Outlook
In 2022, when fossil fuel prices surged three times, the renewable energy capacity added since 2000 globally saved $521 billion in fuel bills in the electricity sector. This achievement, combined with the improved competitiveness and technological advancements in renewable power, marks the next stage of the global energy transition and establishes clean energy electrification as the key factor driving this transition.