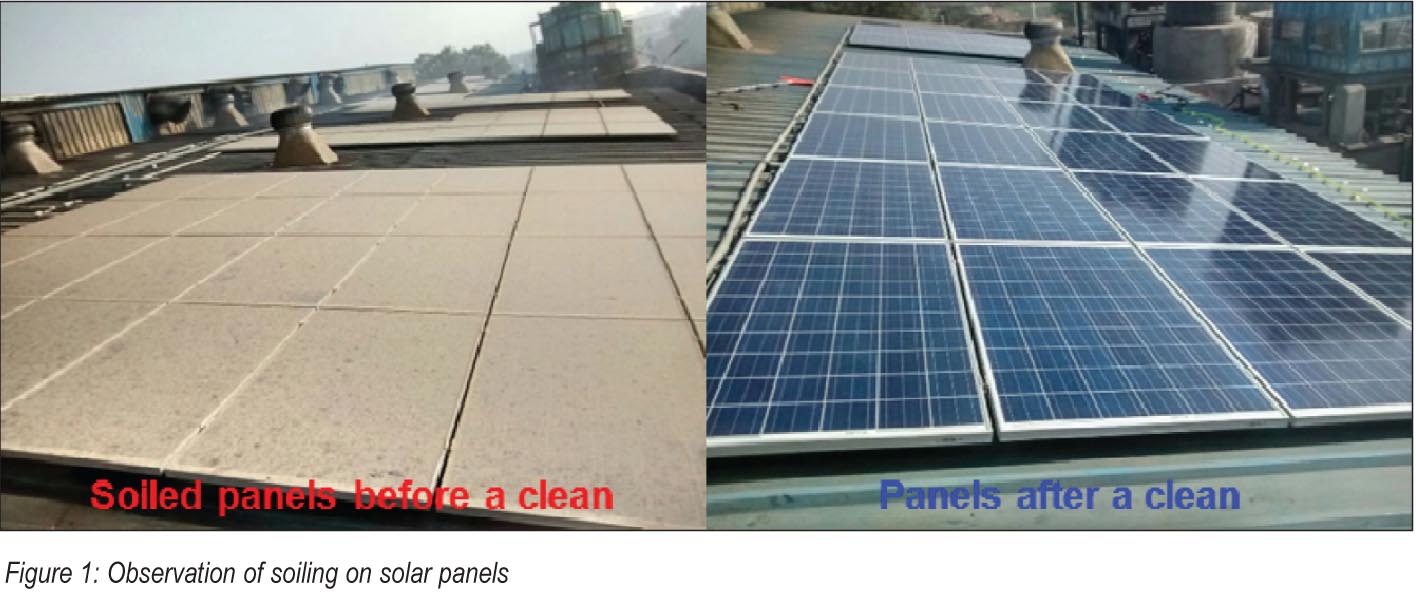
Although the majority of solar systems in India are deployed at a multi-MW scale in solar farms, cities like New Delhi have seen an upsurge in industrial rooftop PV facilities, especially in the suburbs and the surroundings of the city centre (within a 100 km radius). A recent paper, “Advanced Analyses of Loss Mechanisms for PV Systems in Delhi, India” presented at the 32nd European Photovoltaic Solar Energy Conference and Exhibition, investigated two loss mechanisms that prevent PV systems in the Delhi area from achieving their maximum power output potential. These are soiling due to dust accumulation on the module surface, and air pollution. The paper found that the soiling rates in Delhi can lead to losses of 0.3-0.6 per cent per day. Meanwhile, air pollution-related blockage could lead to yield losses of about 6 per cent on an annual basis. Such information is crucial for PV system owners and developers alike for evaluating and maintaining PV asset deployments in Delhi. The highlights of the study are as follows.
Due to a large population and vehicle fleet and many heavy-industry zones, air pollution in Delhi has increased significantly in the past years. Further, a thick layer of smog envelops the city in winter due to agricultural fires during September-January. The deteriorating air quality can deter optimal PV system performance and reduce power output in two ways – soiling due to the accumulation of dust particles on panels and the blockage of sunlight from reaching PV panels due to scattering or absorption of pollutant aerosols in the air.

 Method
Analytical procedures were used to process ground data collected from various PV systems (AC power output) and sensors (in-plane global irradiation) for a period of three months in Delhi.
Soiling analysis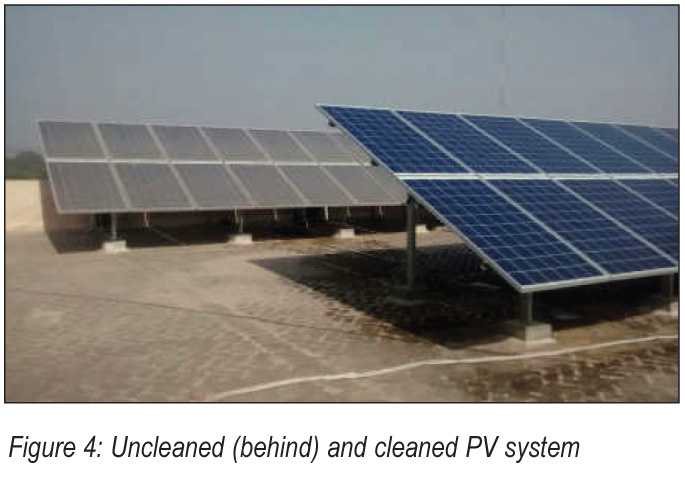
To gauge the immediate effect of soiling, the performance ratio of PV systems was evaluated at several sites, with cleaning routines in place for certain sections of the system. The cleaning routines allowed for a comparison of different subsystems on the same rooftop with identical characteristics such as same tilt and orientation.
In one such soiling test a few system sections were left uncleaned during August-October 2015 in order to gauge the soiling impact. As dust accumulates fast on ground-based irradiance detectors, hourly satellite data was used to derive the performance ratio, based not on a tilted irradiance sensor, but rather on tilted values of data coming from the satellite model, adjusted to the tilt/orientation of the system at hand. This step brought a refinement in analysis, thus enabling the comparison of performance ratios before and after cleaning cycles without irradiation sensor biases. The average ratio of five days prior to the cleaning was compared with the performance of five days post-cleaning. Satellite data was provided by GeoModel Solar.
In the second investigation step, a meteorological station was deployed (March 2016) with silicon sensors for global horizontal irradiation measurement cleaned on a daily basis. An extra sensor was deployed to facilitate this study, acting as a soiling baseline. The sensor was not cleaned for the first two months of the lifetime of the station, which coincided with the dry season of Delhi. Then, a major rain shower after two months effectively cleaned the soiling sample sensor.
 Air pollution analysis
To determine the effect of air pollution, readings from irradiance sensors were filtered. The findings were matched against a clear sky model generated for Delhi, where the air quality index is usually above 300 with concentration of particulate matter (PM) 2.5 during periods of heavy air pollution. Comparisons were drawn to a city in south India (Chennai) where air pollution is minimal. A weighted yearly loss value was estimated for the Delhi region, based on previous literature. Silicon sensors in the station were factory calibrated (±5.0 per cent precision, from Mencke & Tegtmeyer). A pyranometer with a precision of ±2.0 per cent (SMP10, from Kipp & Zonen) was also deployed for future investigations. Ambient temperature and relative humidity sensors were also installed to facilitate secondary analysis such as identification of rain showers due to humidity spikes.
Results and discussions
 Soiling investigations
Four PV systems deployed during July-September 2015 were evaluated in the Delhi region, all within a 100 km radius from the centre of the city. No cleaning routines were implemented for these systems from the beginning. The period of three to four months between the deployment of the systems and the end of the exercise (early December 2015) did not present many occurrences of rain showers. The average five-day performance ratio of the systems, based on satellite-derived data (and not ground sensor data), was evaluated. Satellite data for the Delhi region was chosen as a baseline for the study especially as some sites did not have irradiance sensors or had sensors that had not been cleaned regularly. Performance ratio improvement was in the range of 27-39 per cent. As the systems had been left uncleaned for three to four months, it was estimated that the potential soiling accumulation rates ranged from 0.3 per cent to 0.6 per cent per day.
With the goal of calculating the soiling accumulation rate in more detail, a meteorological station was deployed. One of the silicon sensors was left uncleaned since the start of station operations (March 17, 2016). The left side of Figure 5 shows the front glass surface of the sensor fully cleaned on the date of commencement of the exercise. The centre part of Figure 5 shows the soiling on the surface of the sensor after two months. Irradiation losses in relation to a daily-cleaned baseline sensor stabilised at 20-23 per cent, with the slope indicating soiling accumulation rates of 0.3-0.4 per cent per day. Heavy rain showers occurred in Delhi around the end of May 2016. The rain almost entirely cleaned the sensor (see the right side of Figure 5 and also Figure 6 with values of irradiation ratio against the clean sensor nearly back to day 1 levels). Although soiling accumulation rates varied between the two exercises, the investigations serve as a general guide for the quantitative impact of soiling in the Delhi region. The visual outcomes of the exercise indicate that PV systems in this area require regular cleaning. It could be further discussed that the silicon sensor surface does not match that of a solar PV panel, in terms of its area and even the type of glass cover. However, such an exercise with two benchmarked silicon sensors would entail a lower complexity/cost and could be replicated elsewhere.


Air pollution investigations
Due to the absence of a meteorological station during the hazy months of November through February, one PV site with a silicon sensor was selected where the sensor was cleaned at regular intervals until a dedicated station was launched. The results in this paper came from those readings. Figure 7 shows the filtered values utilising the methodology presented earlier, with the generation of typical meteorological days. When compared to a clear sky model for Delhi for November, the values in Figure 7 indicate a drop of about 20 per cent in irradiation for the period. For assessing the impact of air pollution, data for November-February was used for gauging the irradiation loss levels, which ranged from 20 per cent to 40 per cent for single days, and up to 30 per cent for the heavy polluted months on average.
The potential loss levels of irradiation due to haze were estimated at about 6 per cent. Because some sites are rather remote, defined by the availability of operations and maintenance staff, cleaning of irradiance detectors cannot happen on a daily basis when deployed next to PV systems. This is likely to cause errors in the readings of a whole month. Such investigations could be further refined with the new data from the meteorological station, with daily maintenance routines in place.

 Conclusions
With negligible precipitation in Delhi during November 2015 to January 2016, results for the soiling exercises were validated by a single cleaning cycle and findings from the newly deployed meteorological station. Daily soiling loss accumulation rates of 0.3-0.6 per cent were estimated. The cleaning cycle revealed gains of up to 40 per cent in performance ratios, highlighting the necessity of regular cleaning routines to guarantee profitability to investors and system owners alike. The rainy season could provide further insights into the self-cleaning potential of the region. Reductions in irradiation of up to 40 per cent were detected for single days under analysis due to air pollution.
More investigations are needed with irradiance sensors that are cleaned on a daily basis. These are now available in a recently deployed meteorological station, also benchmarked against other sensors (such as a research grade pyranometer). Lower levels of air pollution during the summer months in Delhi suggest that the effect throughout the year, weighted against historical irradiation levels for the city, would equal to total annual yield losses of around 6 per cent in PV systems deployed within a 100 km radius of the city centre.
Based on the findings of the research paper titled “Advanced analyses of loss mechanisms for PV systems in Delhi, India” authored by André M. Nobre, Daksh Dave, Alan Khor, Raghav Malhotra, and Shravan Karthik of Cleantech Energy Corporation Limited; Ian Marius Peters of Massachusetts Institute of Technology and Thomas Reindl of Solar Energy Research Institute of Singapore.

