
By Anukriti
Renewable resources emerged as the leading preference for new power generation technologies in 2017 as clean energy sources accounted for a 70 per cent share in net generation capacity additions worldwide, supplying an estimated 26.5 per cent of the global electricity. About 178 GW of capacity was added in 2017 and by the end of 2017, global renewable capacity stood at over 2,195 GW, a 9 per cent increase over 2016.
The renewable energy development was mainly led by the solar photovoltaic (PV) and wind power segments, accounting for 55 per cent and 29 per cent of the newly installed capacity, respectively. Hydropower (11 per cent) and bio-power (4.6 per cent) comprised the remaining share. Thus, in 2017, renewable capacity addition exceeded that of coal, natural gas and nuclear power combined. Moreover, the total renewable power capacity more than doubled during the 10-year period 2007-17, with the capacity of non-hydropower renewables increasing by more than six times.
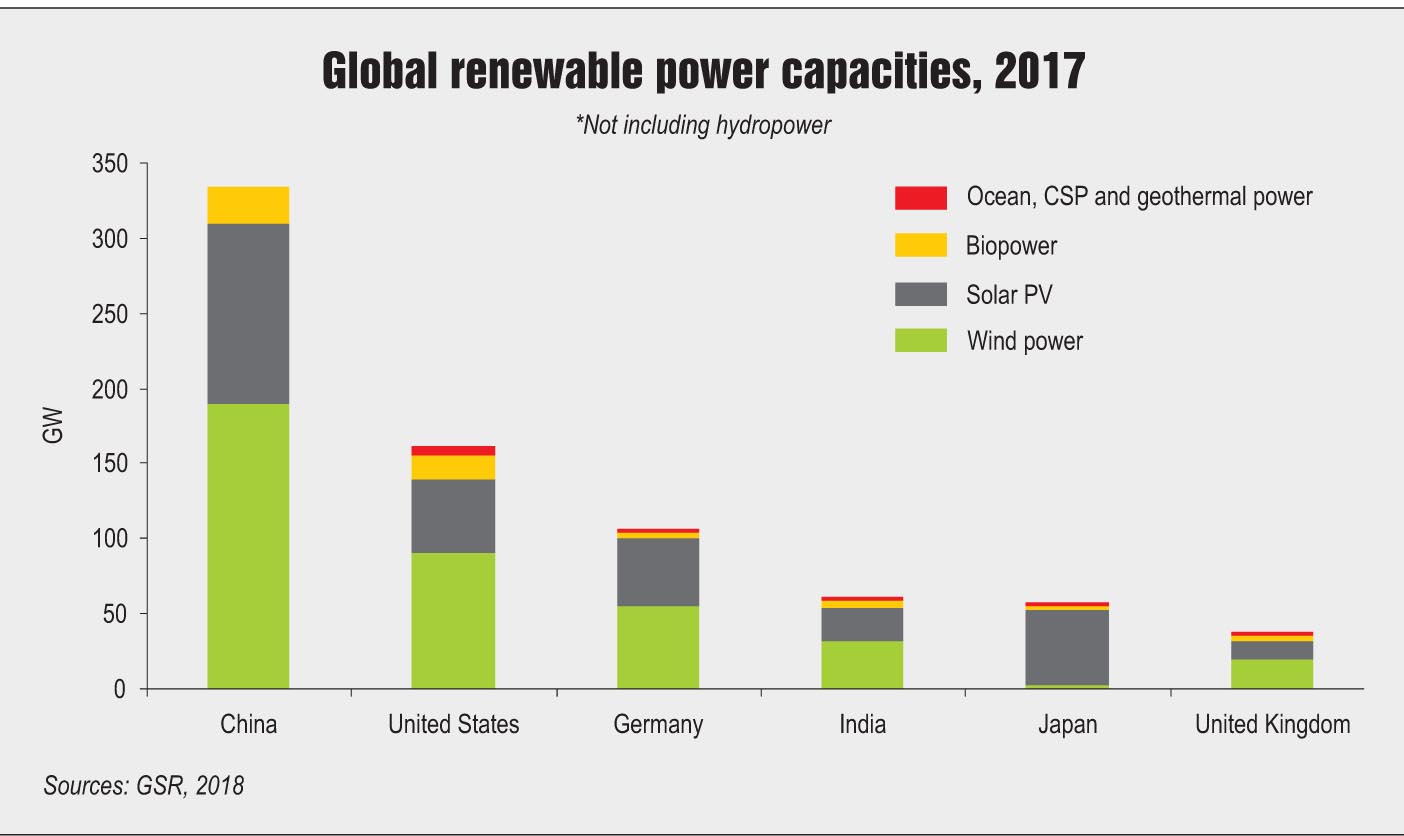
Supported by ambitious targets, a strong manufacturing industry, and policy and regulatory initiatives, China emerged as the leader in renewable energy capacity installation in 2017 (647 GW), making up 30 per cent of the global renewable capacity. It was followed by the US (161 GW), Germany (106 GW), India (61 GW) and Japan (57 GW). This progress can be attributed to a combination of factors such as falling costs of solar PV and wind due to innovations in technologies, changes in market dynamics, introduction of effective policies and uptake of new business models. On the flip side, renewables have taken a few steps back in terms of energy consumption. As of 2016, renewables accounted for an estimated 18.2 per cent of the global energy consumption, down from 19.3 per cent in 2015, primarily due to the continued growth in overall energy demand. The following is a synopsis of the Renewables 2018 Global Status Report, REN21.
Solar power outshines others
In 2017, China led in the solar PV segment, accounting for more than 50 per cent of the installed capacity globally. The country added 53.1 GW of solar PV in this period taking the cumulative solar capacity to 131.1 GW and exceeding the Chinese government’s minimum target for 2020 (105 GW). The US placed second, adding 10.8 per cent, while India came in at a close third contributing 9.3 per cent of the global solar PV additions in 2017.
The global concentrating solar thermal power (CSP) capacity lagged behind with only 2 per cent increase in 2017 as compared to the previous year. Solar thermal projects worth about 100 MW were added during the year, taking the net global capacity to around 5 GW, with Spain and the US making up for around 80 per cent of this capacity. About 2 GW of CSP projects are under construction across China, the Middle East and North Africa, and several under construction facilities are approaching commercial operations. In addition, solar water heating systems worth about 35 GWth were commissioned in 2017, and the total global capacity stood at 472 GWth by year’s end.
 Modest growth in wind power
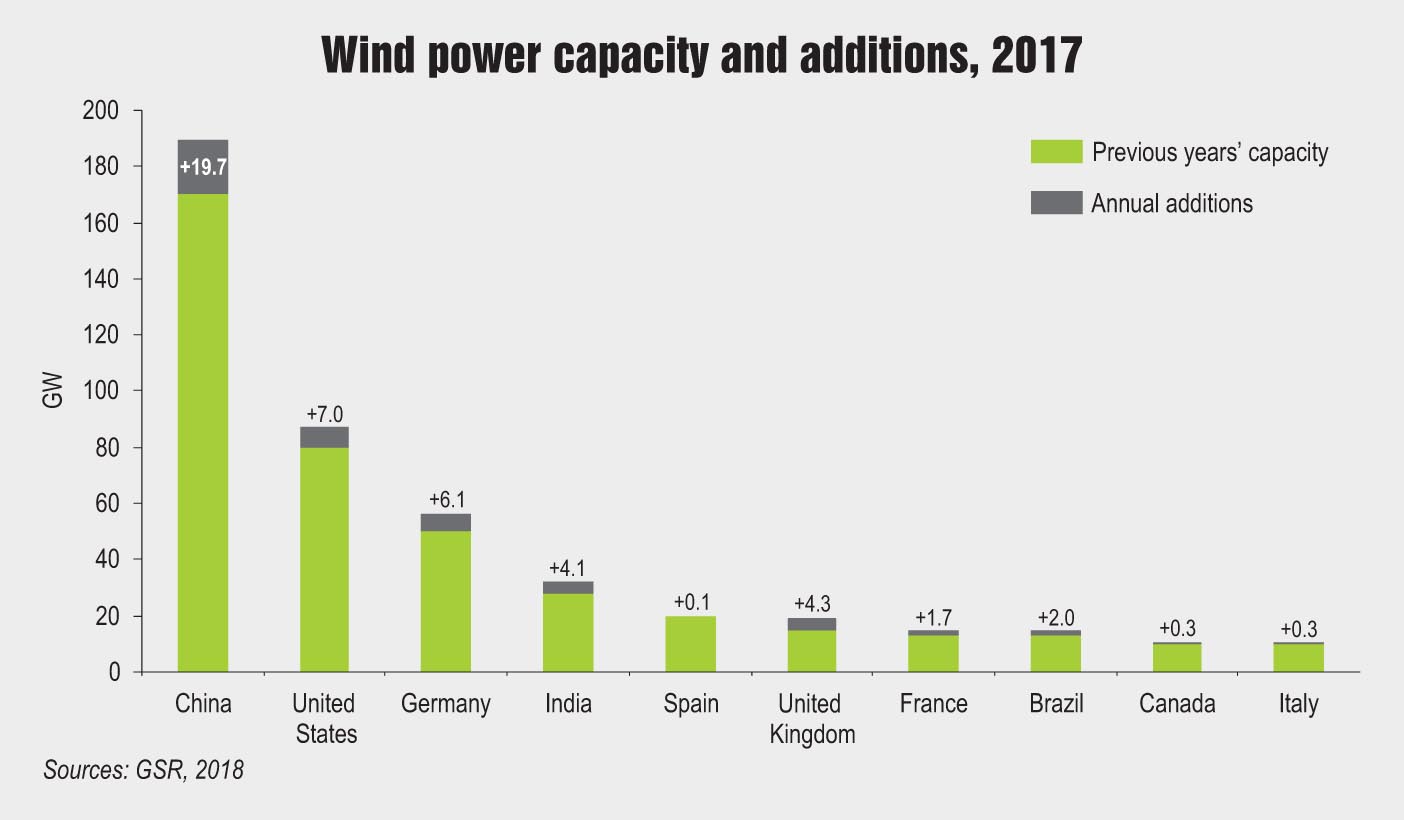
The wind energy segment experienced modest growth compared to 2015 and 2016, with more than 52 GW added globally in 2017, increasing the global total by about 11 per cent and taking the total installed capacity to 539 GW. Unsurprisingly, China emerged as the leader in this segment as well (adding 19.7 GW to the existing capacity by end-2017) and was followed by the US (7 GW), Germany (6.1 GW), the UK (4.3 GW) and India (4.1 GW).
Onshore wind power continued to account for the majority (more than 96 per cent) of the global installed capacity. However, the total offshore wind capacity increased by 30 per cent in 2017 to 18.8 GW. This capacity was distributed amongst a handful of countries (17), with most of the projects being set up in Europe. The UK maintained its lead for total installed offshore capacity (6.8 GW) followed by Germany (5.4 GW), China (2.8 GW), Denmark (1.3 GW) and the Netherlands (1.1 GW).
Bioenergy segment faces a slowdown
In 2016, biomass accounted for 12.8 per cent of total global final energy consumption, down by 9 per cent from the previous year. Traditional biomass made up the majority of biomass consumption. However, with greater international efforts being made to provide access to cleaner energy, this has gradually declined over the past several years. The contribution of bioenergy towards meeting the final energy demand for heating in buildings and industry continues to outweigh its use in the electricity and transport sectors combined.
In the transport sector, liquid biofuels remain the primary renewable energy source. In 2017, there were around 70 countries with biofuel mandates and required specific shares of biodiesel or ethanol to be blended into transport fuels. However, there are concerns about the sustainability of some biofuels and many of the new biofuel promotional policies include specifications for the use of next-generation cellulosic biofuels or advanced biofuels.
Many European nations have started promoting the use of bioenergy for heating purposes in building industries in order to meet their national clean energy targets. The European Union used an estimated 3.6 EJ of bio-heat in 2016. The majority of this (about 91 per cent) was supplied from solid biomass, along with contributions from biogas and municipal solid waste (4 per cent each). Germany was the largest consumer (0.52 EJ) of bio-heat in the EU, followed by France (0.45 EJ), Sweden (0.36 EJ), Italy (0.32 EJ) and Finland (0.30 EJ).
In the power sector, global bio-based installed power capacity increased by 7 per cent to 122 GW between 2016 and 2017 and bioelectricity generation rose almost 11 per cent to 555 TWh. China overtook the US as the largest biopower producer. The other major producers were Brazil, Germany, Japan, the UK and India.
 Steady growth of hydropower
In 2017, global hydropower capacity reached approximately 1,114 GW and the total electricity generation was 4,185 TWh, up about 2 per cent from 2016. The leading countries for cumulative capacity were China, Brazil, Canada, the US, Russia, India and Norway.
A minimum of 19 GW of new hydropower capacity was commissioned by the end of 2017, the smallest capacity addition in this segment seen over the last five years. The country that added the most capacity in 2017 was China, followed by Brazil, India, Angola, Turkey, Iran, Vietnam, the Russian Federation, Sudan and Cote d’Ivoire. Pumped storage hydropower (at 153 GW capacity) was the dominant source of large-scale energy storage, accounting for an estimated 96 per cent of global energy storage capacity.
Geothermal makes a mark in select regions
About 0.7 GW of geothermal capacity came online in 2017, bringing the global total to 12.8 GW. The countries with the largest amounts of geothermal power generating capacity at the end of 2017 were the US, the Philippines, Indonesia, Turkey, New Zealand, Mexico, Italy, Iceland, Kenya and Japan.
The US had the highest installed capacity of geothermal power (2.5 GW) and in 2017, the country generated around 16 TWh of geothermal-based electricity, which accounted for 0.4 per cent of its net generation. Indonesia and Turkey remained in the lead for new installations, accounting for three-quarters of the new capacity during the year.
 Energy storage and EVs make headway
The energy storage market for utility-scale and stationary applications continued to expand in 2017 due to improvement in technology and falling costs. By the end of the year, global grid-connected energy storage capacity stood at an estimated 159 GW, with pumped storage accounting for the vast majority. In 2017, pumped storage capacity worth 3 GW was commissioned. The pumped energy storage segment was followed by thermal storage, batteries (electro-chemical) and electro-mechanical storage.
Globally, 1.2 million units of electric vehicles (EVs) were sold in 2017, up by about 58 per cent over 2016. The number of EVs globally deployed on roads passed the 3 million mark in 2017. Many countries are now experimenting with using EVs to store renewable energy and provide ancillary services to balance renewables.
Long way to go in achieving electricity for all
In 2016, approximately 14 per cent of the world’s population (or 1.06 billion people) still lacked access to electricity, the majority of which were residents of Sub Saharan Africa and Asia-Pacific regions.
A few countries tapped into renewables to provide off-grid and distributed renewable power to their citizens and by the end of 2016, 300 million people had electricity access through distributed renewables. For example, 13 per cent of the population in Bangladesh gained access to electricity through off-grid solar systems, while 51 per cent of the off-grid population of Kenya was connected to distributed renewables. By December 2017, almost 130 million off-grid solar systems were sold cumulatively to provide electricity access to 360 million people worldwide.
In 2017, 13 renewable energy-based large mini-grid projects (with a capacity greater than 100 kW) were implemented in countries outside of the Organisation for Economic Co-operation and Development (OECD) and China, primarily in Africa and Southeast Asia. About 35 new mini-grid projects were announced worldwide in 2017, although many smaller mini-grids are not included in these estimates.
 Surge in investments in renewables
The global investments in renewable power capacity were three times higher than those in new fossil fuel capacity in 2017, a huge win for the clean energy sector. Global new investment in renewable power and fuels (not including hydropower projects of more than 50 MW capacity) was approximately $280 billion in 2017, a 2 per cent increase over the investments made in 2016.
The top countries for renewable energy investment were China, the US, Japan, India and Germany. China alone raised $126.6 billion in 2017, accounting for 45 per cent of the global investment. However, considering renewable energy investments relative to GDP, the top investment destinations were Marshall Islands, Rwanda, Solomon Islands, Guinea-Bissau and Serbia. This shows that developing countries were ahead of the developed side of the world in adopting clean energy solutions. Further, a year-on-year region-wise analysis revealed that renewable energy investments rose in China, Latin America (including Brazil) and the Middle East and Africa in 2017 as compared to 2016, while they fell significantly in Europe, the US and Japan. In India, too, the investment of $10.9 billion made in the sector in 2017 was 20 per cent less than that made in 2016.
Despite investments falling in the US, the country retained its position as the largest individual investor among developed economies, with a total of $40.5 billion put into the sector in 2017. In emerging solar destinations such as Mexico and Argentina investments jumped roughly nine-fold. Investment increased by nearly six-fold in Egypt, to $2.6 billion, while in the UAE, it rose by 29 times to $ 2.2 billion.
In the off-grid renewable energy segment, $922 million was invested between 2012 and 2017. In 2017, off-grid solar companies raised $284 million, a decrease of 10 per cent from the $317 million raised in 2016. Of this, pay-as-you-go solar companies attracted nearly all of the investment (around $263 million).
Moving to renewables alone will not be enough
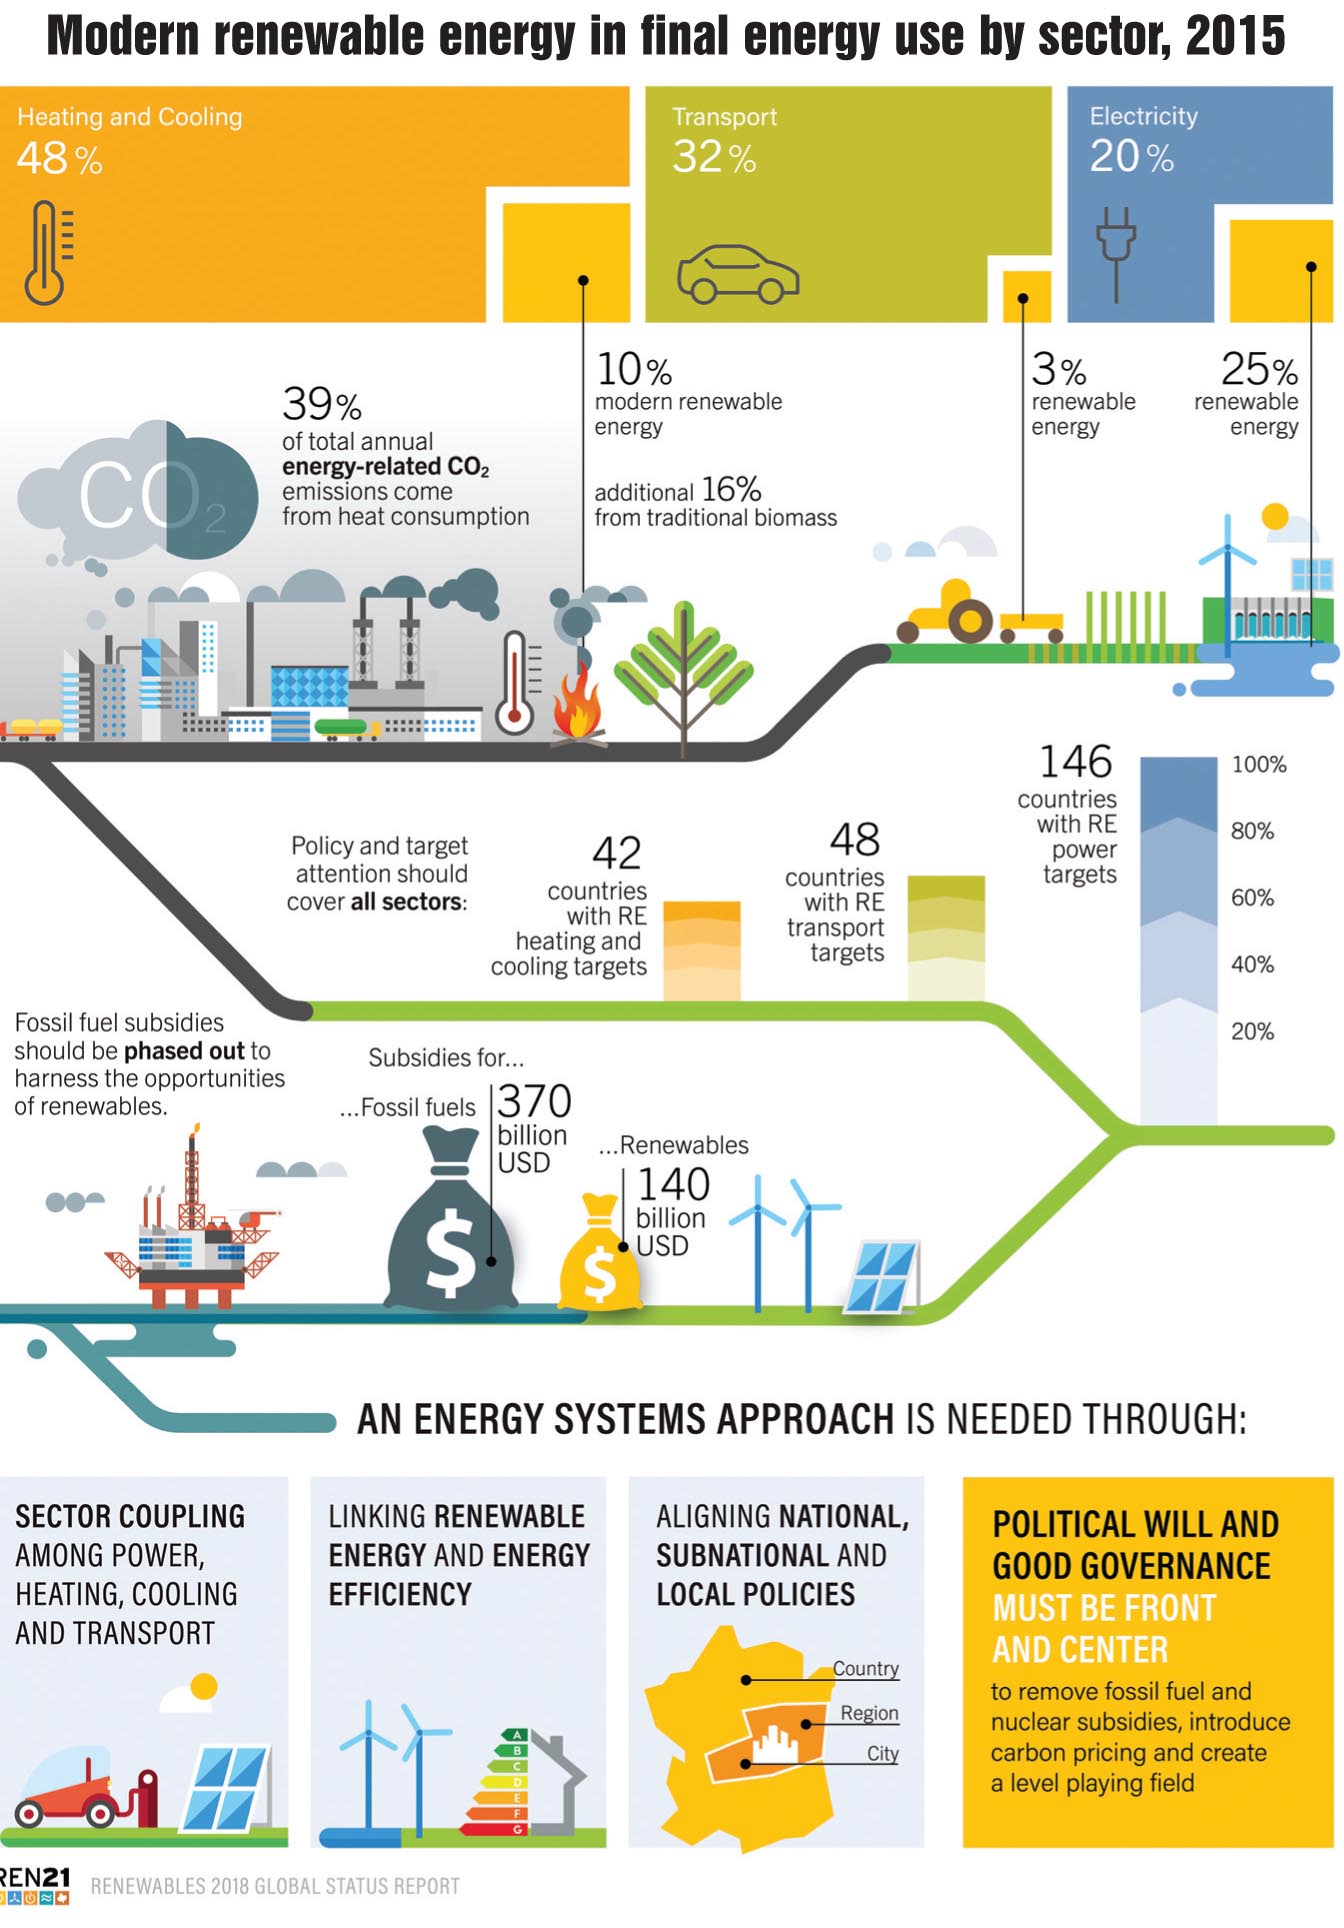
Despite many major positive developments, renewables and the broader energy space face several challenges, primarily because their progress has been uneven across different sectors. In the past years, the policy support for renewables has largely focused on the power sector. As of end-2017, 128 countries had put in place power policies, 70 had policy frameworks in the transport sector while only 24 countries had designed heating or cooling policies for renewables. While EVs are being promoted in many countries, few efforts have been made to directly link renewables for powering EVs; limited examples can be seen in Austria and Germany.
Thus, while on the one hand the renewable energy revolution in the power sector has led to a change towards a clean energy future, on the other hand, the overall energy transition has not advanced with the required speed. Therefore, countries need to urgently come together and acknowledge that the power sector cannot alone fulfil the emission reduction targets laid out in the Paris Climate Agreement.
The heating, cooling and transport sectors, which cumulatively account for almost 80 per cent of the global final energy demand, also need a boost to adopt clean technologies. Further, fossil fuel and nuclear subsidies need to be phased out to promote greater renewable energy adoption. The developments in 2017 reveal that it is possible to move from a renewable electricity-based transformation to a renewable energy-based transformation.