The financial and operational performance of state-owned power utilities has been a constant concern for the sector. While various efforts have been made in the recent past to improve the financial health of the state utilities and promote investment in the sector, the debt level of utilities (distribution as well as generation) continues to be higher than the desired levels.
The Power Finance Corporation (PFC) recently released the “Report on the Performance of State Power Utilities for 2013-14 to 2015-16”, the fourteenth in the series, providing comprehensive information on key financial and operational performance parameters of the utilities. The report is based on a survey conducted across more than 100 power utilities (gencos, transcos and discoms, including power departments). The report points to the continuing increase in the book losses of utilities and the dependence on subsidies, but also highlights that there has been a significant improvement in the net worth of the utilities.
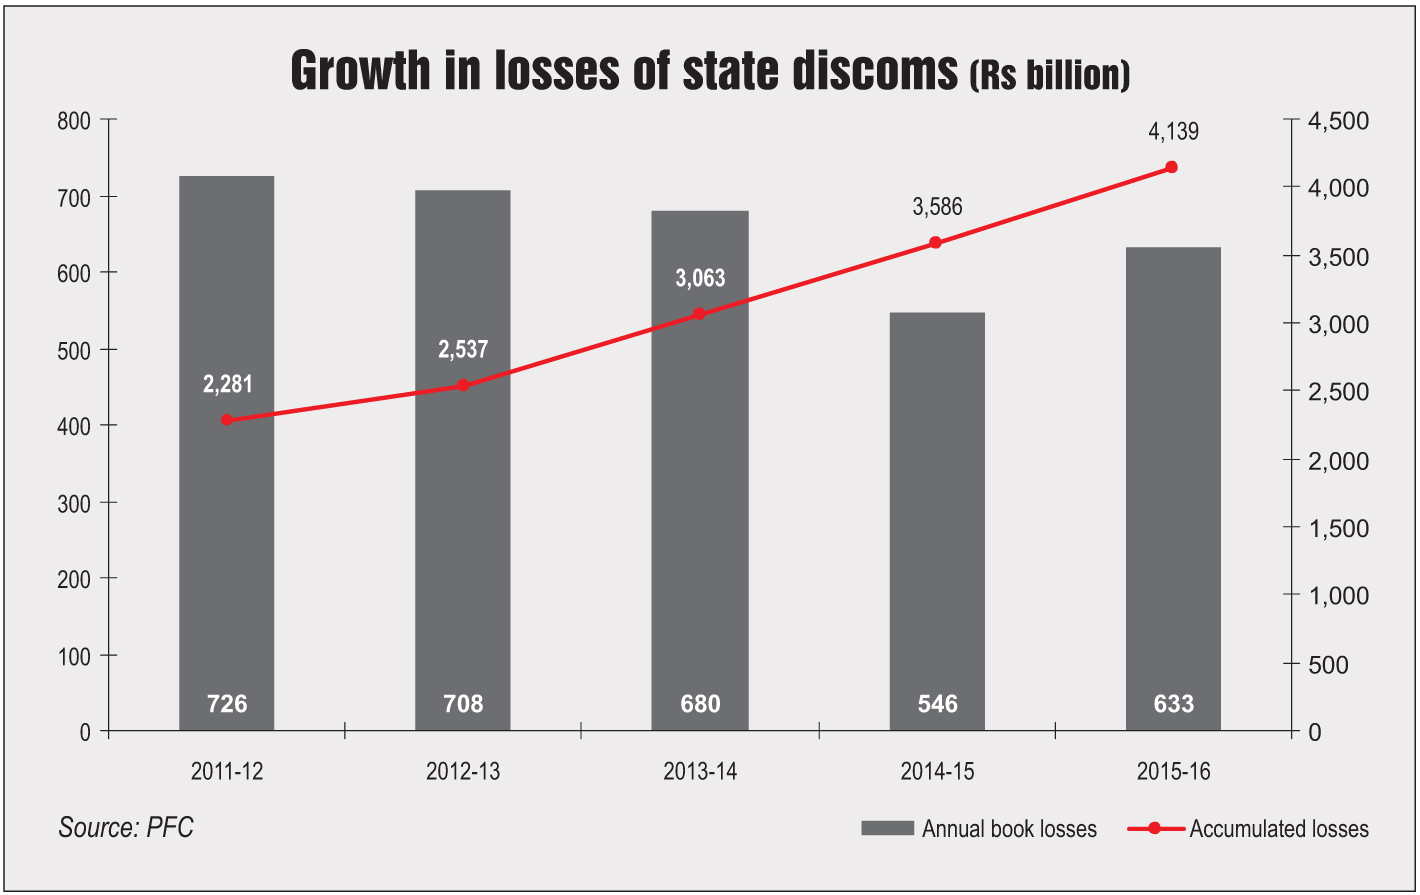
With respect to the distribution segment, losses of Rs 633.21 billion were recorded, with only 13 discoms registering profits in 2015-16. The discoms also registered a revenue gap (on a subsidy-booked basis) of Re 0.63 per unit and a cost recovery of 77.86 per cent, among other things.
Renewabl Watch summarises the key findings of the report…
Financial performance
Revenue and expenditure
In 2015-16, the total income (excluding subsidy) of utilities selling directly to consumers marked a year-on-year growth of 5.08 per cent to reach Rs 4,249.48 billion from Rs 4,016.17 billion in the previous year. In 2014-15, the year-on-year growth rate was almost 13 per cent. Meanwhile, the growth in the aggregate expenditure of these utilities was much more than that in their total income. In 2015-16, the aggregate expenditure increased to Rs 5,457.79 billion from Rs 5,037.74 billion in 2014-15, marking a year-on-year increase of 8.33 per cent. The level of cost recovery for distribution companies worsened due to a higher increase in aggregate expenditure in 2015-16, after recording a slight improvement in 2014-15. The cost recovery stood at 77.86 per cent in 2015-16 against 79.72 per cent in 2014-15 and 77.06 per cent in 2013-14.
Profits and losses
Aggregate losses (without accounting for subsidy) of all utilities increased from Rs 1,140.07 billion in 2014-15 to Rs 1,472.98 billion in 2015-16. Only West Bengal, Delhi, Uttarakhand and Puducherry recorded profits (without subsidy) in 2015-16. Meanwhile, the aggregate book losses (on a subsidy-booked basis) of all the state power utilities increased from Rs 660.22 billion in 2014-15 to Rs 896.03 billion in 2015-16. Aggregate losses on a subsidy-received basis of all state power utilities, however, increased from Rs 684.18 billion in 2014-15 to Rs 920.12 billion in 2015-16.
While some states, including Tamil Nadu, Rajasthan, Haryana, Kerala, Chhattisgarh and Madhya Pradesh, showed a substantial improvement in terms of a reduction in book losses, others like Maharashtra, Uttar Pradesh, Punjab, Andhra Pradesh and Jharkhand witnessed an increase in book losses. Five states – Maharashtra, Uttar Pradesh, Rajasthan, Tamil Nadu and Madhya Pradesh – accounted for over 80 per cent of the total losses in 2015-16. Meanwhile, the aggregate book losses of utilities selling directly to consumers increased from Rs 545.58 billion in 2014-15 to Rs 633.21 billion in 2015-16. On a subsidy-received basis, the losses stood at Rs 657.18 billion in 2015-16, marking an increase of 15 per cent over the Rs 569.39 billion in 2014-15. Out of 53 discoms, 47 recorded losses without subsidy and 41 discoms recorded losses on a subsidy-received basis.
Subsidies
In absolute terms, the total subsidy booked by utilities selling directly to consumers increased by 20 per cent, from Rs 479.65 billion in 2014-15 to Rs 576.8 billion in 2015-16. Further, as a percentage of revenues from the sale of power, the subsidy booked by these utilities stood at 14.7 per cent in 2015-16 as against 12.9 per cent in 2014-15. The subsidy released by the state governments as a percentage of the subsidy booked by utilities was around 95 per cent in 2014-15 and 2015-16. In 2013-14, the subsidy released was as much as 99 per cent.
Capital deployed and net worth
Over the past few years, the capital deployed in the sector (excluding the net worth prior to 2001-02 for power departments) has improved progressively. On a year-on-year basis, the total capital deployed stood at Rs 7,679.79 billion as of March 31, 2016 as against Rs 6,299.16 billion as of March 31, 2015, marking an increase of almost 22 per cent. Further, borrowing from financial institutions, banks and other market sources continued to be the major source of capital deployed in the sector. However, the share of these borrowings in the total capital deployed decreased significantly from 96 per cent in 2014-15 to 77 per cent in 2015-16.
Meanwhile, the share of state government loans in the total capital employed increased from 9 per cent in 2014-15 to 17 per cent in 2015-16. The total equity investment in the sector also went up from Rs 2,513 billion as of March 31, 2015 to Rs 3,751.29 billion as of March 31, 2016, recording an increase of 49 per cent. Apart from this, the aggregate net worth of utilities improved, though it continued to be negative. The negative net worth stood at Rs 631.54 billion as of March 31, 2016 as compared to Rs 1,175.34 billion as of March 31, 2015.
Operational performance
AT&C losses
The average aggregate technical and commercial (AT&C) losses for utilities selling directly to consumers at the national level decreased from 25.72 per cent in 2014-15 to 23.98 per cent in 2015-16. Of the five regions, the southern region recorded the lowest AT&C losses of 16.24 per cent. Further, 21 states recorded an improvement in AT&C losses. Meanwhile, the overall collection efficiency improved from 94 per cent in 2014-15 to 95.44 per cent in 2015-16.
ACS-ARR gap
On the revenue gap front, the performance deteriorated marginally. The average cost of supply (ACS) increased from Rs 5.21 per unit in 2014-15 to Rs 5.43 per unit in 2015-16, while the average revenue realised (ARR), without considering subsidy booked, increased to Rs 4.15 per unit in 2014-15 and to Rs 4.23 per unit in 2015-16. The ACS-ARR gap thereby worsened to Rs 1.20 per unit in 2015-16 from Rs 1.06 per unit in 2014-15. Meanwhile, the gap on a subsidy-booked basis also increased from Re 0.56 per unit in 2014-15 to Re 0.63 per unit in 2015-16. Similarly, the gap on a subsidy-received basis increased from Re 0.58 per unit in 2014-15 to Re 0.65 per unit in 2015-16. Region-wise, the utilities in the eastern, north-eastern and southern regions had a lower gap than the national average in 2015-16. Of the 55 distribution utilities, Nagaland’s Department of Power recorded the highest revenue gap (without subsidy) at Rs 4.79 per unit, followed by the Northern Power Distribution Company of Telangana (Rs 3.41 per unit), Arunachal Pradesh’s Department of Power (Rs 3.33 per unit) and the Power Department of Jammu and Kashmir (Rs 3 per unit).
Conclusion
The PFC report has provided a comprehensive view of the performance of state-owned utilities. As highlighted in the report, the performance of the power utilities continues to be gloomy, with a high level of losses, a large revenue gap and negative net worth. The situation of the discoms is particularly dismal, which directly impacts the generation and transmission companies.
That said, there has been some improvement in discom finances on the back of the Ujwal Discom Assurance Yojana launched by the government in November 2015. However, this fact has not been fully captured in the report since it tracked data till only March 2016. In sum, it is evident from the report that there is still a lot of scope for performance improvement by the power utilities.